Table of Contents
0x0C. Fuzzing
Slides
Slides are available here.
Tutorials
Introduction
Fuzzing is a technique for testing certain kinds of software by feeding the target with thousands of random generated inputs. From now on, the target is the software program that we test using the fuzzer. Fuzzing is used by companies to test their internal developed software, or by security companies to analyze interesting pieces of software(delivered as binaries).
Fuzzers are divided into two main categories based on the target form as source code or binary file. Fuzzers that work with “source code”, can use compiler features to instrument the binary code with coverage handlers and sanitizers, thus the fuzzer can use information from the target itself. The second class of fuzzers, that work with binary files, must run each instruction in an environment that allows the fuzzer to collect execution feedback data. In the following tutorial, we will consider only the latter class.
Basic Blocks
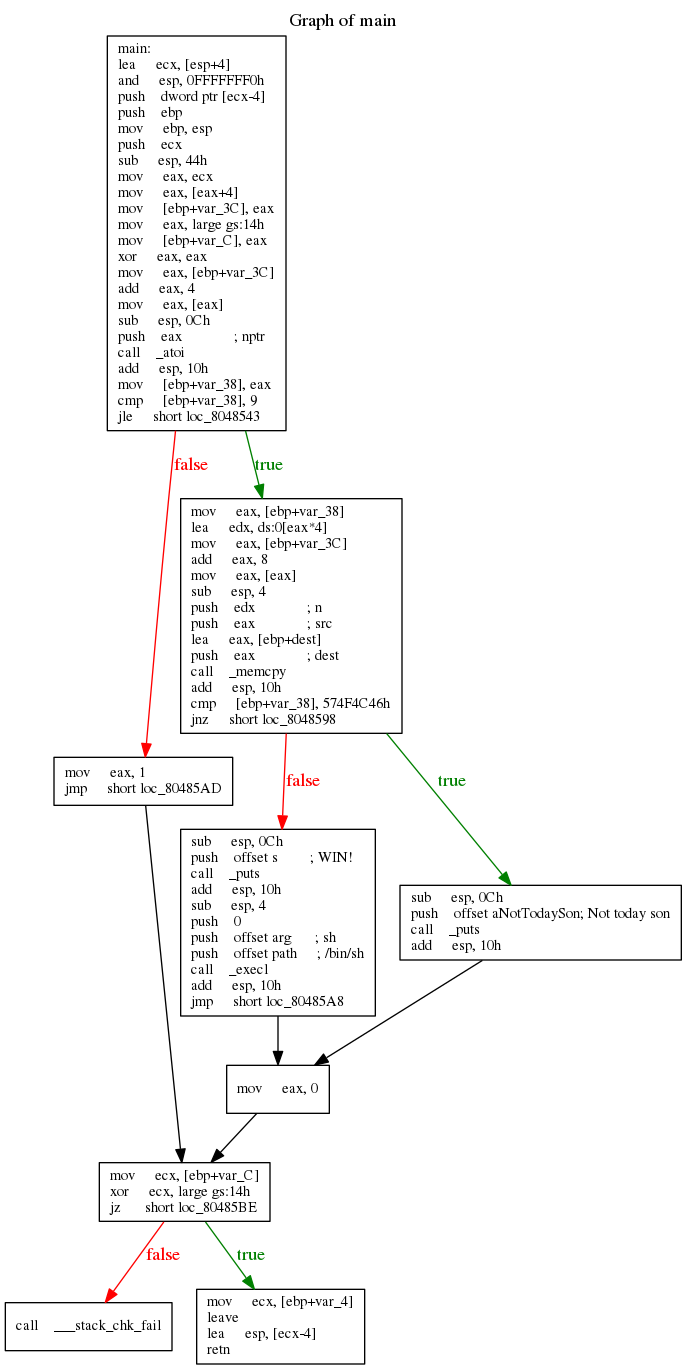
In order to understand what fuzzers try to achieve, we must understand the flow graph of a program. The flow graph is the target program layout representing all the paths that can be traversed during program execution. Its representation corresponds to a graph where the nodes correspond to basic blocks. The direct edge between two basic blocks represent that there is a jump instruction after the first block that directs the execution to the second basic block. The first basic block, called also the entry block is the first block to be executed.
To understand this concept, let's have a look at the graph below. It represents the smashthestack blackbox level7 binary flow graph.
In Linux, when we want to run a program using the command:
$ ./test
the loader process starts. It reads the test executable header and finds the entry point. The loader will end its execution and will let the target program continue by setting the $eip register to the entry point address of the target program(test). When we analyze the program flow, we will not consider the basic blocks executed before the entry basic block of the target program, but it is useful to know that loading is handled by code outside our executable. Most of the time, the basic blocks executed before the first basic block of main function represent initialization code that calls certain libc handlers.
The address of the entry block can be found in the executable metadata using the command:
$ readelf -h level07
ELF Header:
  Magic:   7f 45 4c 46 01 01 01 00 00 00 00 00 00 00 00 00
  Class:                             ELF32
  Data:                              2\'s complement, little endian
  Version:                           1 (current)
  OS/ABI:                            UNIX - System V
  ABI Version:                       0
  Type:                              EXEC (Executable file)
  Machine:                           Intel 80386
  Version:                           0x1
  Entry point address:               0x8048370
  Start of program headers:          52 (bytes into file)
  Start of section headers:          3560 (bytes into file)
  Flags:                             0x0
  Size of this header:               52 (bytes)
  Size of program headers:           32 (bytes)
  Number of program headers:         7
  Size of section headers:           40 (bytes)
  Number of section headers:         35
  Section header string table index: 32
The first basic block of main function ends with instruction
jle short loc_8048543
This instruction will set the $eip register to two possible values, depending on the codition evaluation. If the condition evaluates to true, then eip is set to the address of:
mov eax, ebp + var_38
Otherwise, eip is set to the address of:
mov eax, 1
The instructions that divide the code into basic blocks are called branch instructions. These can be:
- Unconditional jumps (jmp)
- Conditional jumps (je, jne, jg, jge, jl, jle, jz, etc.)
- call instruction
- ret instruction
- syscall/sysenter instruction
How do fuzzers work
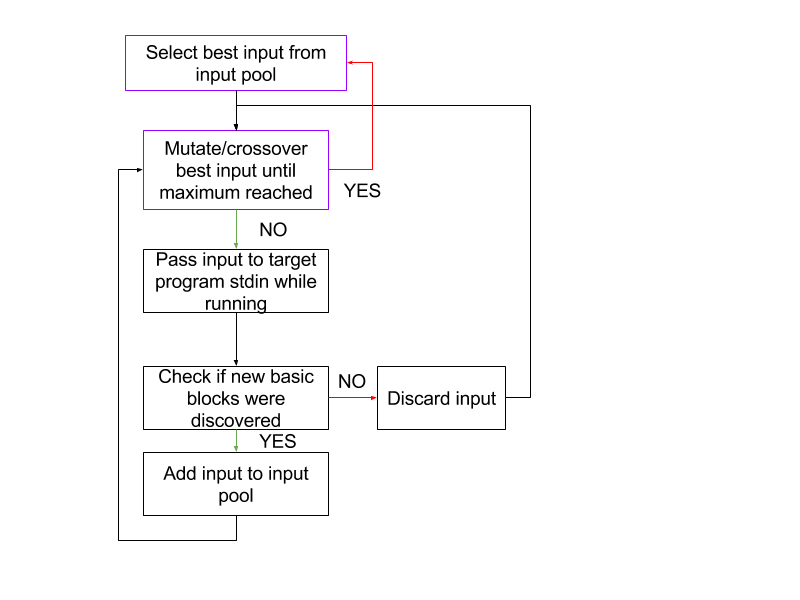
Briefly, a fuzzer is a program the generates input randomly and feeds the input to the target program. The target program is a x86/x86_64 binary. Now we will understand how the input is generated, how does the target program receive the input and most important, what is execution feedback and how the fuzzer makes use of it. The fuzzer architecture is based on two main components:
- The mutation engine - mutate input in order to discover new basic blocks
- The scheduling engine - choose the best input to be mutated
The mutation engine is the component that holds a byte array(input_array) of certain size (max_len). The byte array is filled with 0x0 when the engine starts. The target program is executed and input_array is send to target program stdin. The execution ends and fuzzer receives information about how the target program behaves when input_array is passed as input. Using the execution feedback of the previous target execution, the mutation engine will flip a bit, or will apply other mutation technique in the hope that the new input will execute a different code path in the target program. As an example, have in mind that a fuzzer that tests a simple json parser library executes the target 20K-30K times per second, meaning that in a second, ~25K different inputs are generated and passed to target program stdin, respectively.
The scheduling engine is the component that decides what input had a relevant impact on fuzzing effectiveness. Each generated input is evaluated after the target program executes the input. By executing the input, we mean:
$ cat input | ./a.out #the input is sent to the target program. The target program executes using input as stdin stream.
So, after executing each input, it is then evaluated using a specific function that receives execution feedback as parameter.
int EvaluateInput(unsigned char *input, ExecutionFeedback &ef);
The evaluation function consists of one or more heuristics that are strongly related to the type of software we are testing. For example, the most common heuristic is finding the input that has s, smallest.
s = execution_time x input_length
Why? If execution_time is small, then the fuzzer can generate inputs and run the target with these inputs faster. The input_length is important because we aim to find the shortest input that will find a certain crash. For example, let’s consider a buffer overflow where the buffer size is 0x20. The buffer overflow will crash the program if we overwrite the return address with garbage. So if
input_array = 0x20 x “A” + 0x4 x “A” + 0x4 x “A” (buffer + old ebp + return address)
the program will crash because it tries to execute code at address 0xAAAAAAAA. In this case, input_array is 0x28 x “A”. If input_array is 0x29 x “A”, the program will still crash, but we only care about the shortest input that will trigger the crash.
Another heuristic used is not based on a “grade”, but will simply discard some kind of inputs. An input is considered interesting in the following scenario: when the target program runs using input as stdin stream, some basic blocks (sequences of instructions ending in branches) in the program are executed. The set of basic blocks executed for a certain input is called a trace. If one input trace contains a basic block that was not discovered by any other previously executed inputs, then this particular input is called interesting. For example:
int main() {
	char a[0x20];
	int ret = read(0, a, 0x30);
	if (a[0] == 'A') {
		yes();
	}
        if (a[1] == 'B') {
		no();
	}
	return 0;
}
This would translate into assembly:
Input “AA” will execute the basic blocks {1, 2, 3, 5}, but not basic block 2. Let’s suppose that input “AB” will execute after. Input “AB” will be marked as interesting, because its trace will exercise basic blocks {1, 2, 3, 4, 5}.
The scheduling engine will sort all previously executed inputs by the “grade” returned by the evaluation function and will also discard inputs that do not contribute to fuzzing effectiveness.
We mentioned execution feedback a few times in the above section. First prototypes of fuzzers were not intelligent at all. Back in the 90’s when the concept was introduced for testing the core utilities in Linux, the fuzzers generated random input with no link to how much code the previous execution exercised. Nowadays fuzzers use an important metric to evaluate their effectiveness: code coverage. If we are not certain that a program contains an issue or a vulnerability, then reaching as much code as possible using a fuzzer, will prove the p% of the code does not contain issues. On the other side, if we know with precision that a vulnerability is present in the target program but we don’t know where it is, code coverage is not a good metric. Instead of achieved code coverage, a fuzzer effectiveness is measured using the time to reach a bug metric.
For educational purposes, we will explain further how code coverage is used during fuzzer runtime. The other metric is relevant for induced bugs in CTF-like contests, but not for real world vulnerabilities, that are not known a priori.
As we mentioned above, each target execution is linked with a set of basic blocks reached. So we can consider the pairs :
(input, {bb | bb is a basic block in the target program})
Keep in mind that the order in which the basic blocks were discovered or how many times they were reached is not relevant in generic fuzzing.
An input is interesting if the execution of target program with the aforementioned input will exercise one or more basic blocks that were not previously exercised by any other input. Coverage-based fuzzers rely more on increasing the number of basic blocks discovered, than on discovering a certain issue in an isolated area of the code.
Fuzzing with a view
The following code snippet describes the rough components of a fuzzer:
while(true) {
    I = getBestInput(Inputs);
    for (int i = 0; i < maxMutation; ++i) {
        I’ = mutateInput(I);
        interesting  = Run(I’);
        if (interesting) {
            Inputs.push(I’);
        }
    }
}
Driller - augmenting fuzzing with symbolic execution
Driller is a software verification system for detecting vulnerabilities in small binaries. Driller is built on top of afl and angr. Afl is the most popular fuzzing engine that discovered unknown critical issues in software like qemu, libtiff, sqlite and many more. When afl gets stuck in certain compare instructions, it may take between two minutes and two days to generate an input that will satisfy a condition. Or worse, it can take forever …
In this situation, we can use a very interesting technique discovered somewhere in the 80’s, called symbolic execution(SE). The theory behind SE is based on running every path in the target program using symbolic values for variables. When a path exits with error code or zero, a set of constraints is collected and resolved. Pure SE works only in theory because the number of paths in most programs is too large and the constraint set cannot be solved in deterministic time with the current available resources.
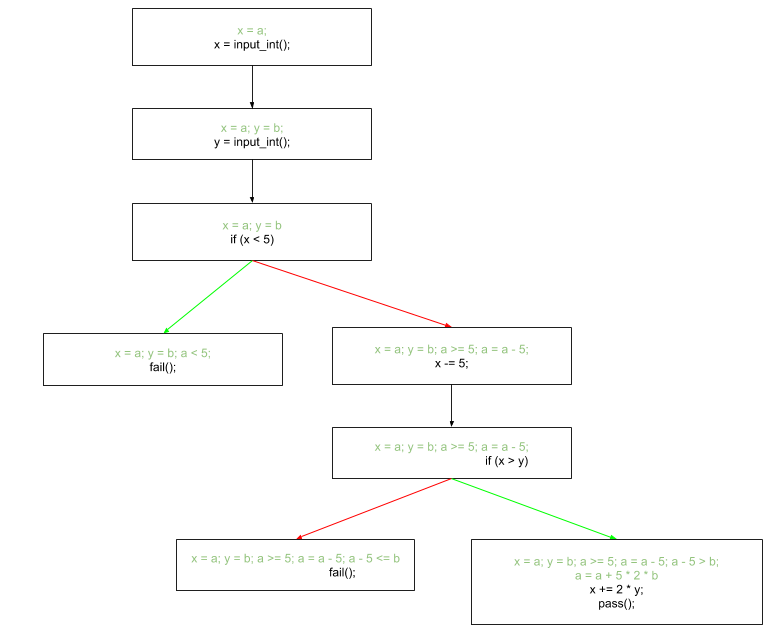
Here is an example of how symbolic execution works. We chose the input as numbers because the constraints can be understood better.
x = input_int();
y = input_int();

if (x < 5)
    fail();
x -= 5;
if (x > y)
    x += 2 * y;
    pass();
fail();
If we execute this code symbolically, we should proceed like this;
In practice, concolic execution is used. This technique is based on gathering concrete values along symbolically executing a path. Consider the above code. When we execute the program with SE, x = a. After the first comparison, we gather the constraint a < 5. What happens with a >= 5? We keep a set s of possible paths that will be explored later in the order we discover them. When executing the branch where x < 5, we add to the set s = {(a >= 5)}. After running f, the next path that is executed will not consider a to be a symbolic value, but a concrete one. Concolic execution is a partial solution to the path explosion issue of normal depth-first or breadth-first approaches.
angr is the concolic execution engine integrated in driller. Now that we have an idea about how it works, let’s see some blood.
Installing Driller
Driller is a pretty complex framework comprising a bunch of components: a fuzzer (AFL), a symbolic execution engine (angr) and some scaffolding to use the two together. If you're running the lab VMs, they will most likely come with Driller preinstalled. Otherwise, follow the steps here to (hopefully) get it up and running.
First, let's install some dependencies:
sudo apt-get install python-dev libffi-dev build-essential virtualenvwrapper debootstrap debian-archive-keyring
Then, we'll need a new Python virtual environment. Following the Python virtualenv tutorial:
$ # replace the following with your favourite Python virtualenv directory
$ mkdir ~/.environments
$ export WORKON_HOME=~/.environments
$ # replace the following with your virtualenvwrapper.sh location if needed
$ source /usr/share/virtualenvwrapper/virtualenvwrapper.sh
Then, we'll create the driller virtualenv:
$ mkvirtualenv driller
(driller) $
mkvirtualenv will create the new virtual environment and activate it. To activate the existing driller virtualenv in a new terminal, run:$ workon driller (driller) $ python my_driller_script.py
For more details, refer to the Python virtualenv guide.
Now we need to install a bunch of components while inside the virtualenv:
(driller) $ # driller
(driller) $ pip install driller
(driller) $ # angr tracer
(driller) $ git clone https://github.com/angr/tracer && pip install -e ./tracer
(driller) $ # afl
(driller) $ git clone https://github.com/shellphish/shellphish-afl.git && pip install -e ./shellphish-afl
...
    Setting up AFL-other-arch
    Setting up AFL-cgc
    Getting libraries
    W: Cannot check Release signature; keyring file not available /usr/share/keyrings/ubuntu-archive-keyring.gpg
...
If this happens, the following dirty trick should save you: edit shellphish-afl/fetchlibs.sh and replace the definition of UBUNTU_KEYRING with the value of DEBIAN_KEYRING.
Now we should be all done! If the first task works for you, then you should be all set.
Tasks
The archive can be downloaded from here.
driller Python virtualenv:$ workon driller (driller) $
Task 1: Intro
The first task can be found in task-01/fst. Let's analyze the binary.
objdump -M intel -d fst | less
The main function seems to call run and then return.
8048554: e8 8f ff ff ff call 80484e8 <run>
In run, a buffer is allocated and then fgets is called. Also, some checks are done using strncmp. We used to analyze the binary until we can generate a payload that crashes our program. This time we use a smart tool to crash our program, driller.
Driller provides a python api that we can use to analyze fst.
import driller
binary_name = "./fst"

d = driller.Driller(binary_name, "A" * 0x40, "\xff" * 65535)
new_inputs = d.drill()
print(new_inputs)
The first parameter passed to driller is the binary path. The second parameter is a reference input (it should be long enough to crash the program). The third parameter is the fuzzer bitmap with no discovered transitions. Run the above code. The result contains a set of inputs discovered by driller. We can see that all inputs start with “SSS”. If we disassemble fst again, we can find the following instructions:
 804850b:       6a 03                   push   0x3
 804850d:       68 20 86 04 08          push   0x8048620
 8048512:       8d 45 d4                lea    eax,[ebp-0x2c]
 8048515:       50                      push   eax
 8048516:       e8 95 fe ff ff          call   80483b0 <strncmp@plt>
At address 0x8048620 we will find “\x53\x53\x53\x00” which translated to ascii, is “SSS”. So the first three bytes must be “SSS”.
fst and follow the instructions to complete this task. cat input | ./fst
Task 2: Objdump or Driller? Which one is better?
The second task executable can be found in task-02/snd. Analyze the binary using file, objdump and IDA. Do not spend more than 5 minutes. If you couldn't find the proper input, give Driller a shot.
Write a driller script like in the previous example. For each input, run ./snd until you find the one that will print the congratulations message.
Task 3: Codegate - postbox
The executable can be found in task-03/postbox. This task was part of Codegate CTF contest. First, let's see the executable type:
$ file postbox
postbox: ELF 64-bit LSB executable, x86-64, version 1 (GNU/Linux), statically linked, for GNU/Linux 2.6.32, BuildID[sha1]=b5617ebf184ebcd05bfdd952580ef376121a7798, stripped
Analyze the binary using IDA64, subroutine sub_401F20. Because we do not have enough time to dig into each menu and submenu of postbox, we will build a small fuzzer that will feed various inputs to the binary.
Open script file task-03/solve.py. The menu implies that there are a lot of buffers that may be used for buffer overflow. Our job is to find out the buffer that will gain us access to rip register. The script will fill the buffers with payload of 1024 bytes. Your job is to send the payload or the proper option for each step.
After running the script, consult dmesg to see if rip was modified by any of the options.
$ ./solve.py
$ dmesg | tail


