Table of Contents
0x03. Static Analysis
Resources
Get the tasks by cloning Public GitHub Repository.
Setup
For the tutorial and tasks below we will use GDB with PEDA (Python Exploit Development Assistance) and IDA.
Configure GDB locally with PEDA by following the instructions on the GitHub page.
Download IDA Freeware Version.
Initial Info
After obtaining a malicious binary, it isn't such a good idea to run it without prior inspection of what harm it can do. Therefore, you have to extract as much information as possible about the program without actually executing it. This technique is called binary static analysis and can be used to gather a lot of useful details about what the program does and detect potential vulnerabilities. This session describes how a binary executable can be statically reverse engineered by disassembling it, analyzing and annotating the assembly code in order to partially restore its source code.
The first step that has to be taken is to understand the behavior of the application. This can be done by disassembling the binary and retrieving the assembly code. We can use the objdump tool to extract this information from the emperor binary:
$ objdump -M intel -d emperor
Notice that the output of the objdump tool contains a bunch of named labels that indicate the start of functions.
080483fb <caesar>:
08048436 <main>:
This is very useful information because it helps the objdump tool to structure the output based on functions. These names are taken by the compiler directly from the source code and are stored inside the binary as DWARF/debugging symbols.
01. Disassemble methods
Although machine code and assembly is a one-to-one mapping, binary disassembly is not always an easy task. There are several tools that try to generate accurate assembly code starting from a binary. Based on the method they use, we can narrow down two approaches: linear sweep and recursive traversal.
Linear Sweep
Let's strip the debugging symbols and see how objdump behaves:
$ strip emperor
$ objdump -M intel -d emperor
Notice that objdump can no longer differentiate between different functions within the same section, but rather all instructions are dumped one after another, without any delimitation. The reason is that objdump uses the linear sweep technique to interpret the machine code, which has a very straight forward approach: it starts at the beginning of each section and decodes instruction after instruction in a linear way, until the end of the section.
Although there are no other labels in the code to structure the output of the objdump, the resulted code still looks legible. However, there are some critical issues with this approach. Can you predict them? What happens if an instruction cannot be properly decoded? How does objdump recover?
Let's move on to the wrong binary and try to disassemble it. Take a look at the address 0x804840c:
$ objdump -M intel -d wrong
...
 804840c:       eb 09                   jmp    8048417 <__libc_start_main@plt+0x127>
 804840e:       de ad c0 de e9 e8       fisubr WORD PTR [ebp-0x17162140]
 8048414:       7b fb                   jnp    8048411 <__libc_start_main@plt+0x121>
 8048416:       f7 83 ec 0c 68 c0 84    test   DWORD PTR [ebx-0x3f97f314],0xe8080484
 804841d:       04 08 e8
 8048420:       ac                      lods   al,BYTE PTR ds:[esi]
 8048421:       fe                      (bad)
 8048422:       ff                      (bad)
 8048423:       ff 83 c4 10 b8 ff       inc    DWORD PTR [ebx-0x47ef3c]
 8048429:       ff                      (bad)
 804842a:       ff                      (bad)
 804842b:       ff 8b 4d fc c9 8d       dec    DWORD PTR [ebx-0x723603b3]
 8048431:       61                      popa
 8048432:       fc                      cld
 8048433:       c3                      ret
...
Looks awful, right? Some of the instructions are not even disassembled and appear as illegal/(bad). Is this program working though? Let's try to execute it:
$ ./wrong
What is wrong with me :-s?
It runs without any issues! If you take a closer look at the assembly snippet I pasted above, the instruction at 0x804840c is a jmp instruction to 0x8048417. However, we can't see this address in our output, but if we do the math, it is somewhere after 0x8048416 and before 0x8048420. Let's see how this code executes properly. Open it with gdb and set a breakpoint at the start address (0x804840c):
$ gdb -nh ./wrong
(gdb) set disassembly-flavor intel
(gdb) break *0x0804840c
Breakpoint 1 at 0x804840c
(gdb) run

Breakpoint 1, 0x0804840c in ?? ()
(gdb) x/5i $pc
=> 0x804840c:   jmp    0x8048417
   0x804840e:   fisubr WORD PTR [ebp-0x17162140]
   0x8048414:   jnp    0x8048411
   0x8048416:   test   DWORD PTR [ebx-0x3f97f314],0xe8080484
   0x8048420:   lods   al,BYTE PTR ds:[esi]
(gdb) ni
0x08048417 in ?? ()
(gdb) x/5i $pc
=> 0x8048417:   sub    esp,0xc
   0x804841a:   push   0x80484c0
   0x804841f:   call   0x80482d0 <puts@plt>
   0x8048424:   add    esp,0x10
   0x8048427:   mov    eax,0xffffffff
(gdb)
The breakpoint is hit, but notice that gdb only manages to properly disassemble the 0x8048417 address after the instruction pointer moves there. The reason is that the program was containing some overlapping instructions and, although they are not even executed, objdump does not manage to properly parse them. As we saw, we had to execute the binary to disassemble those instructions, thus performing a dynamic analysis.
It is clear now that the linear sweep does not always satisfy our requirements, so let's take a look at a different approach.
Recursive Traversal
The Recursive Disassembling Algorithm is a technique that combines linear sweep with control flow analysis. Basically what it does is to start from the entry point of the program and disassembles instructions in a linear fashion until it finds an instruction that changes the flow of the program (e.g. branches, function calls). At this point it stops disassembling the next instructions and follows the address pointed by the branch instruction, starting a new linear sweep from there. When reaching a return instruction, it goes back and resumes the algorithm from the point it had previously stopped. Since for each jmp instruction, the disassemble continues from the address it points to, we can clearly extract the exact instructions that are executed and properly decode them.
Now let's see how IDA, a recursive traversal based disassemble tool, generates output for our wrong executable.
- Open
idaq→ New → Openwrongexecutable → OK (load it as elf 386 executable) - Go to address (Jump → Jump to address / press G)
0x80483fb
You should see something like this:

Notice that the assembly code is properly decoded and that the extra bytes are no longer interpreted as code, but rather as plain data. That's because the recursive traversal hits the jump at 0x0804840c and follows it, without parsing the dead code at 0x0804840e.
Although recursive traversal is less susceptible to overlapping instructions, it still has some flaws. One of the biggest problem is indirect branching - jumps to addresses that cannot be computed in a static fashion and can only be determined during runtime. Neither recursive traversal nor linear sweep algorithms can predict those addresses, therefore they can only be decoded using a dynamic analysis technique.
02. Stop, IDA time!
We will present a typical IDA workflow on the hyp3rs3rv3r binary. To make things harder we stripped all the symbols. The first screen you are presented with is the following:
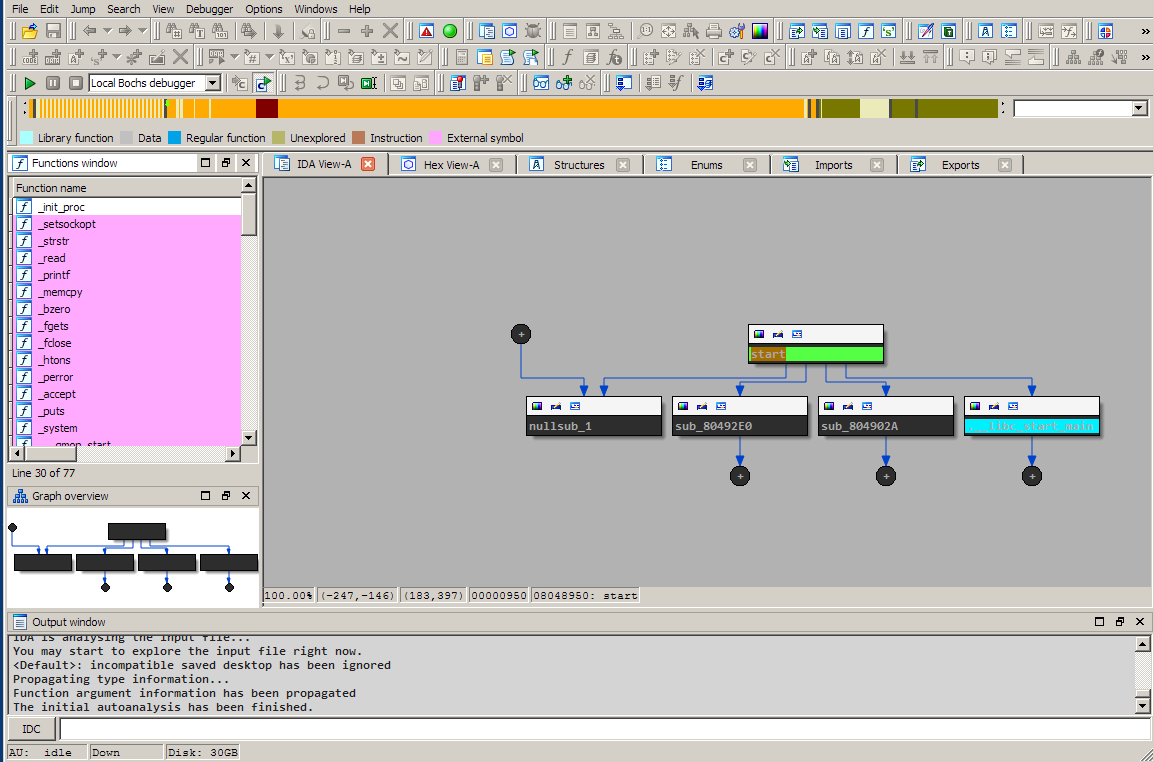 Main components:
- On the left you have the Function window with the list of identified subroutines, functions or external functions called by the binary. They are color coded according to the legend right above it
- Under it you have a graph overview of the view presented on the right
- On the right you have multiple tabs, with the Function summary selected in the IDA-view. We will not be using this. Instead, we will switch to the complete Graph View of functions by pressing the spacebar.
Upon pressing spacebar and navigating in the Function window to functions that are not colored (meaning they are part of this binary) we get the following view: 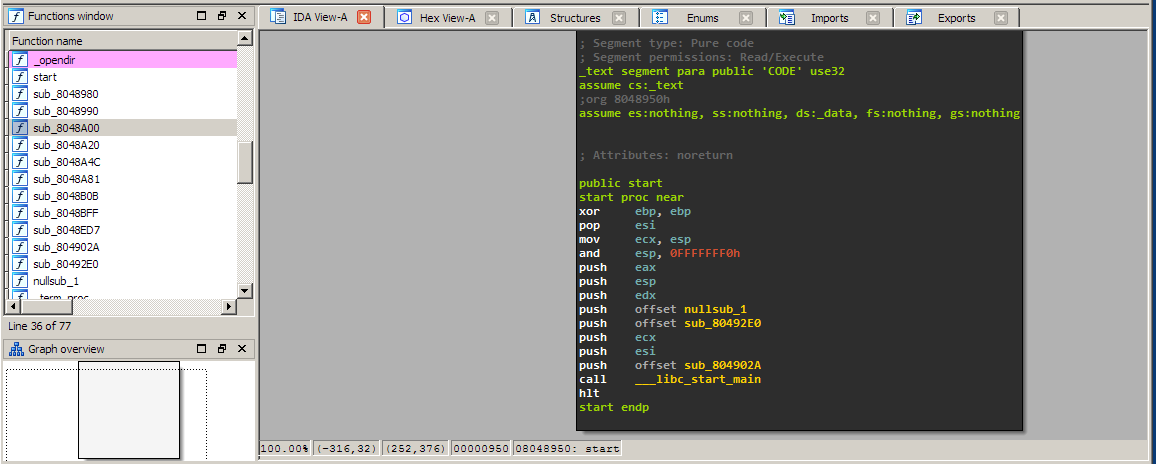
When reversing binaries you will often see this particular assembly construct a lot as it is the standard one generated by gcc. Remember from session 02 that __libc_start_main is the wrapper that calls main. We now rename the last argument pushed on the stack to main. Press n and enter the new name. Now you have your first function identified. Click on it to see what main does:
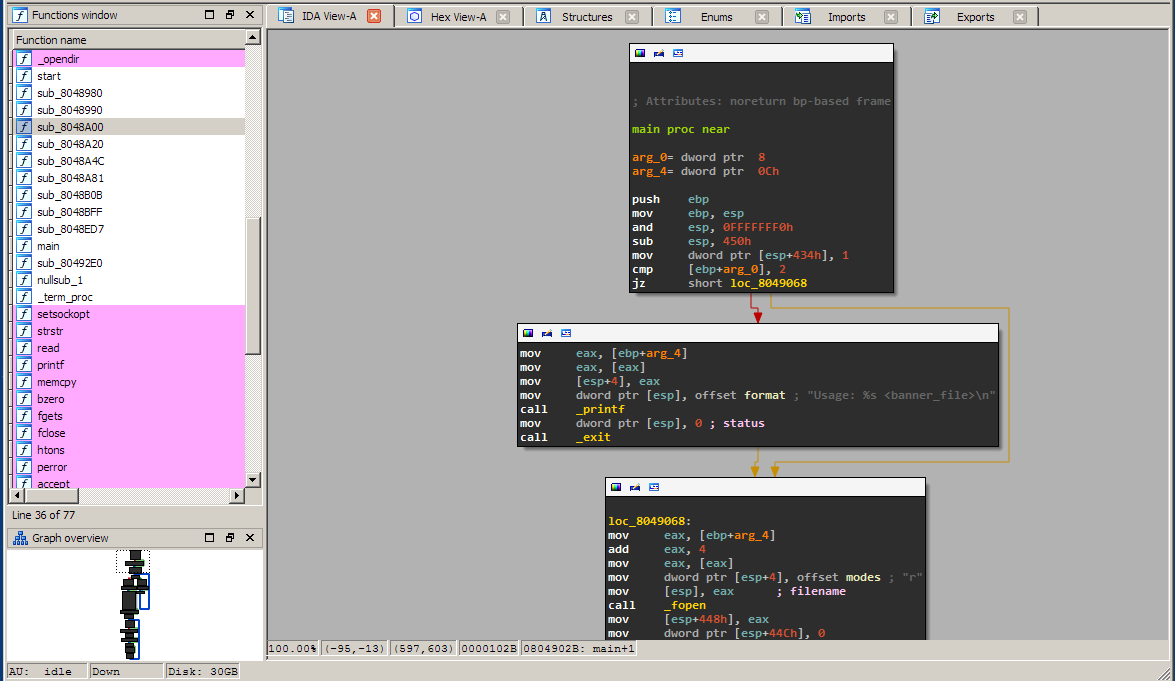
Note how the execution is neatly layed out in a graph view. If you look at the left pane you can see the complete view. The execution is divided because of conditional and unconditional branches. Let's figure out what happens by analyzing the assembly code: First we have the function prologue, stack alignment and stack allocation:
push    ebp
mov     ebp, esp
and     esp, 0FFFFFFF0h
sub     esp, 450h
Next, a variable on the stack is initialized to 1. If you click on 434h it will become highlighted and you can scroll through the whole function to see where it's used later. We ignore this for now.
mov dword ptr [esp+434h], 1
Next we see the first branching:
cmp     [ebp+arg_0], 2
jz      short loc_8049068
So it's referring to the first argument: argc. Basically what it does is:
if(argc == 2) {
	goto loc_8049068
} else {
....
}
What does the else branch do?
mov     eax, [ebp+arg_4]
mov     eax, [eax]
mov     [esp+4], eax
mov     dword ptr [esp], offset format ; "Usage: %s <banner_file>\n"
call    _printf

mov     dword ptr [esp], 0 ; status
call    _exit
Pretty straightforward if you remember the tasks from session 02. The second argument (argv) is dereferenced and pushed on the stack along with a format string. Then printf is called. Next, exit is called with a status of 0.
if(argc == 2) {
	goto loc_8049068
} else {
	printf("%s <banner_file>\n", argv[0]);
	exit(0);
}
Now let's do something a bit more advanced: we want to identify the 2 commands that the server accepts from static analysis. How do we approach this problem as fast as possible? We already know that the server accepts multiple clients. It can do this through forking. Let's see where fork is called in the program. First find the fork function on the left pane and select it. Now you see a stub to it from the PLT section. We want to find all locations in the program that call this function. You can achieve this by obtaining all the cross-references (xrefs) to it by pressing x. You should get the following screen:
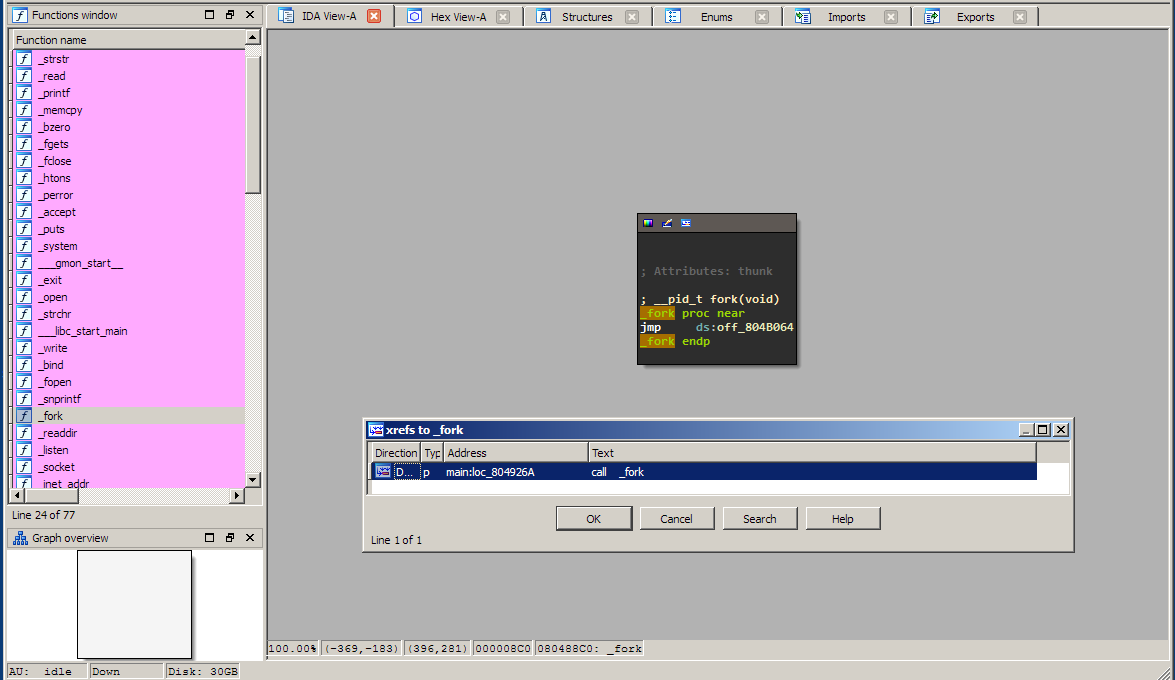
Click that location and you will get to the forking point: 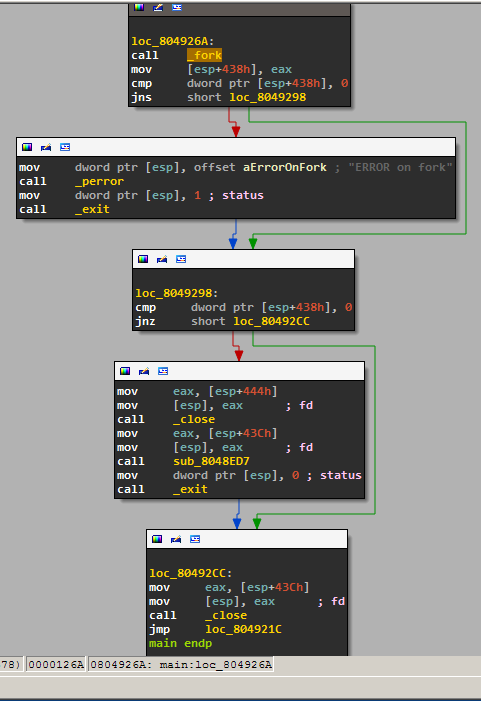
You can see that the return value is stored on the stack at [esp+438h], some error checking (perror and exit) is done and then the return value is checked for 0 (as we traditionally do for fork calls). The child will execute sub_8048ED7 and the parent will loop back. You can rename sub_8048ED7 to something more legible such as handle_child_process
In this function you can now clearly see the two commands and which function is called for each: 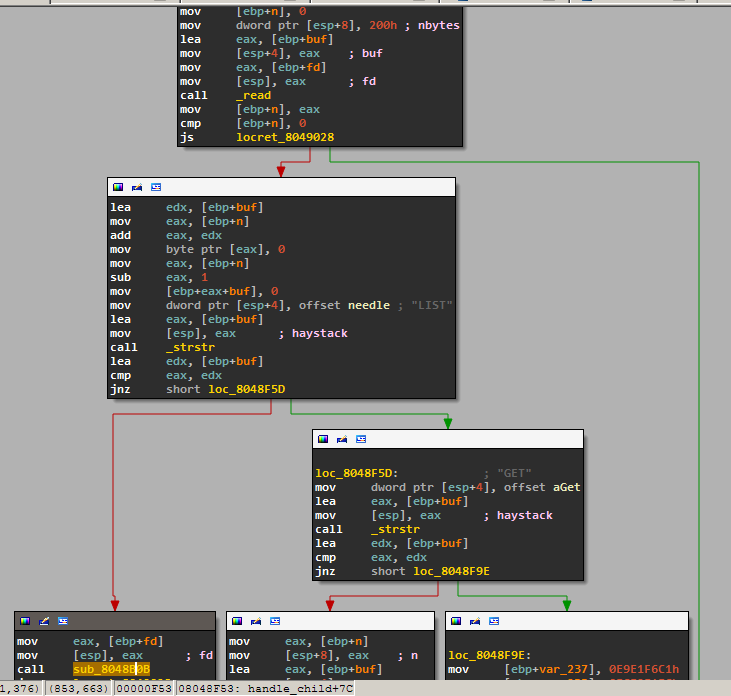
It looks like the one on the left, sub_8048B0B handles LIST so we rename it to handle_LIST. As expected, it calls opendir and readdir to read all the files in the current directory and write them to the socket. 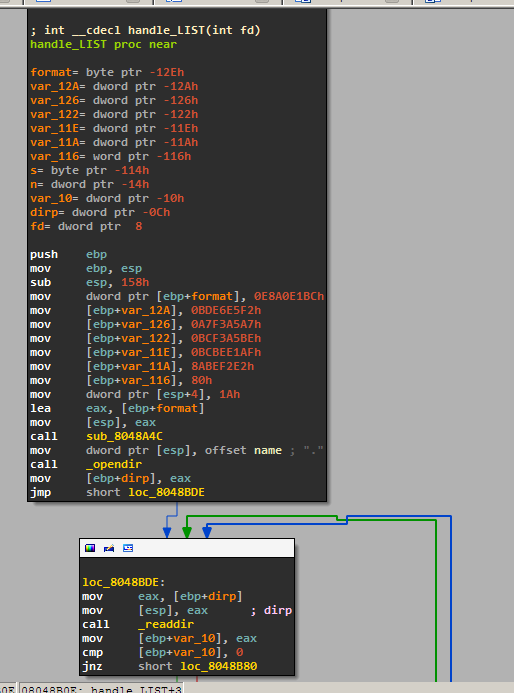
Here's some more useful stuff you need to know while working with IDA
- Saving progress is disabled for the trial version. However, you can save a limited (but useful) subset of your work using
File→ Produce File→Dump database to IDC fileand then load it next time usingFile→Script File. - If you close some windows and don't know how to get them back you can reset the layout using
Windows→Reset Desktop - If you want to return to the previous view you can press
Escape - When you want to view code as in
objdumpyou only need to pressSpacebaronce. And then again to return toGraph viewmode. - If there is a hex value and you want to convert it to decimal (or back) press
h - Converting hex/dec values to ASCII: press
r - If you want to write comments next to an instruction or a function press
:
03. C++ executables
Many binaries now come from C++ source code. It is important to understand the concepts and paradigm shift that comes with C++ binaries. We start with a Hello World application
#include <iostream>
using namespace std;
int main()
{
	cout << "Hello world" << endl;
	return 0;
}
Compile and open it with IDA to be presented with the now familiar _start boilerplate code: 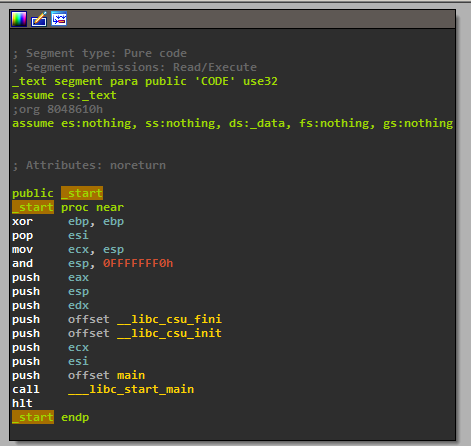 But when we turn to
 main we are in for a shock: 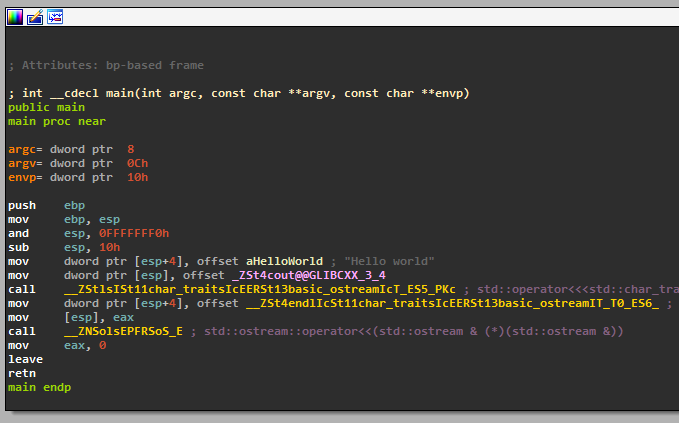
C++, although a very legible programming language, compiles to some really nasty stuff to enable all of its features. Namespaces, class names and polymorphism is achieved through function name mangling. In fact, function names now contain more data such as:
- signature
- data type
- class
- namespace
- structure
- calling convention
- other stuff depending on compiler
Have you ever encountered a problem when using C libraries in C++ and the solution was to declare the functions with the following ? Function mangling is the culprit.
#ifdef __cplusplus
extern "C" {
#endif
    /* ... */
#ifdef __cplusplus
}
#endif
- on demand demangling: http://demangler.com/ or
c++filt
Instead, let's see what can we do in IDA to make it legible. The settings I use (you may prefer something different) are the following:
Options→Demangled names- Show demangled C++ names as
Names Setup short names- Click
Only main name
This inhibits everything except the most important stuff: 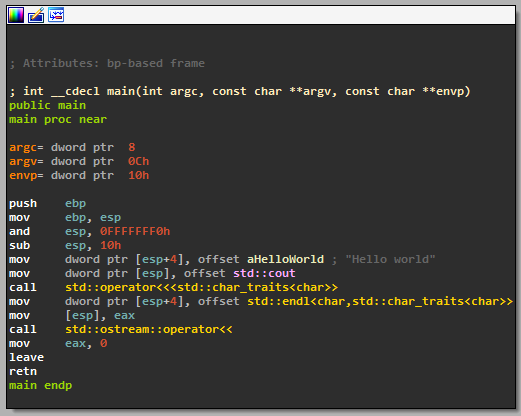
Not perfect but much much more legible.
Features of C++ such as polymorphism translate into other, more complex assembly constructs. Virtual functions, for example, are implemented using virtual function tables. Type information is also present in such binaries.
- https://ocw.cs.pub.ro/courses/cpl/labs/06 (in Romanian)
04. crypto_crackme
The crypto_crackme binary is an application that asks for a secret and uses it to decrypt a message. In order to solve this task, you have to retrieve the message.
- Open the binary using IDA and determine the program control flow. What is it doing after fetching the secret? It seems to be consuming a lot of CPU cycles. If possible, use IDA to patch the program and reduce the execution time of the application. Use
Edit → Patch program → Change byte… - Next, it looks like the program tries to verify if the secret provided is correct. Where is the secret stored? Is it stored in plain text? Find out what the validation algorithm is.
- Now break it and retrieve the message!
Use the library files in the task archive and run the executable using:
LD_LIBRARY_PATH=. ./crypto_crackme
05. broken
The broken binary is asking you for the correct password. Investigate the binary and provide it with the correct password. If you provided the correct password the message That's correct! The password is '...'.
06. hyp3rs3rv3r
- Investigate the hyp3rs3rv3r binary and find out where the backdoor function is. Note that since it's not directly called, IDA doesn't think of it as a procedure so it won't come up on the left pane. Figure out a way around this. When you find that code block you can press
pon the first instruction to help IDA see it as a procedure.