Table of Contents
0x04. Dynamic Analysis
Resources
Get the tasks by cloning Public GitHub Repository.
Tutorials
To brush up on the GDB basics, read Refresher. Taming GDB.
The first part of this session will give you a walkthrough of the most common GDB principles that we are going to use in exploitation. We are going to use these concepts in practice to evade a basic key evaluation program. Let's get to it!
Before GDB
One thing you should always do before firing up GDB is to try to learn all the available information on the executable you're trying to debug through the techniques that have been presented so far.
For the purposes of this session it is a good idea to always run objdump on all the executable files before attaching GDB to them so that you have a better idea of what goes where.
$ objdump -M intel -d [executable]
GDB Basic Commands
Getting help with GDB
Whenever you want to find out more information about GDB commands feel free to search for it inside the documentation or by using the help command followed by your area of interest. For example searching for help for the disassemble command can be obtained by running the following command in GDB:
#print info about all help areas available
#identify the area of your question
(gdb) help
#print info about available data commands
#identify the command you want to learn more about
(gdb) help data
#print info about a specific command
#find out more about the command you are searching for
(gdb) help disassemble
Opening a program with GDB
A program can be opened for debugging in a number of ways. We can run GDB directly attaching it to a program:
$ gdb [executable-file]
Or we can open up GDB and then specify the program we are trying to attach to using the file or file-exec command:
$ gdb
(gdb) file [executable-file]
Furthermore we can attach GDB to a running service if we know its process id:
$ gdb --pid [pid_number]
Disassembling
GDB allows disassembling of binary code using the disassemble command (it may be shortened to disas). The command can be issued either on a memory address or using labels.
(gdb) disas *main
Dump of assembler code for function main:
=> 0x080484c4 <+0>:,  push   ebp
   0x080484c5 <+1>:,  mov    ebp,esp
   0x080484c7 <+3>:,  and    esp,0xfffffff0
   0x080484ca <+6>:,  sub    esp,0x30
   0x080484cd <+9>:,  mov    DWORD PTR [esp+0x12],0x24243470
   0x080484d5 <+17>:,mov    DWORD PTR [esp+0x16],0x64723077
   0x080484dd <+25>:,mov    WORD PTR [esp+0x1a],0x21
....Output ommited.....
(gdb) disas 0x080484c4
Dump of assembler code for function main:
=> 0x080484c4 <+0>:,  push   ebp
   0x080484c5 <+1>:,  mov    ebp,esp
   0x080484c7 <+3>:,  and    esp,0xfffffff0
   0x080484ca <+6>:,  sub    esp,0x30
   0x080484cd <+9>:,  mov    DWORD PTR [esp+0x12],0x24243470
   0x080484d5 <+17>:,mov    DWORD PTR [esp+0x16],0x64723077
   0x080484dd <+25>:,mov    WORD PTR [esp+0x1a],0x21
Adding Breakpoints
Breakpoints are important to suspend the execution of the program being debugged in a certain place. Adding breakpoints is done with the break command. A good idea is to place a breakpoint at the main function of the program you are trying to exploit. Given the fact that you have already run objdump and disassembled the program you know the address for the start of the main function. This means that we can set a breakpoint for the start of our program in two ways:
(gdb) break *main
(gdb) break *0x[main_address_obtained_with_objdump]
The general format for setting breakpoints in GDB is as follows:
(gdb) break [LOCATION] [thread THREADNUM] [if CONDITION]
break command with no parameters will place a breakpoint at the current address.
The abbreviated command for setting breakpoints is simply b.
Listing Breakpoints
At any given time all the breakpoints in the program can be displayed using the info breakpoints command:
(gdb) info breakpoints
(gdb) i b
Deleting Breakpoints
Breakpoints can be removed by issuing the delete breakpoints command followed by the breakpoints number, as it is listed in the output of the info breakpoints command.
(gdb) delete breakpoints [breakpoint_number]
delete breakpoints command with no parameters: (gdb) delete breakpoints
Once a breakpoint is set you would normally want to launch the program into execution. You can do this by issuing the run command. The program will start executing and stop at the first breakpoint you have set.
(gdb) run
Execution flow
Execution flow can be controlled in GDB using the continue, stepi, nexti as follows:
(gdb) help continue
#Continue program being debugged, after signal or breakpoint.
#If proceeding from breakpoint, a number N may be used as an argument,
#which means to set the ignore count of that breakpoint to N - 1 (so that
#the breakpoint won't break until the Nth time it is reached).
(gdb) help stepi
#Step one instruction exactly.
#Argument N means do this N times (or till program stops for another reason).
(gdb) help nexti
#Step one instruction, but proceed through subroutine calls.
#Argument N means do this N times (or till program stops for another reason).
c (continue), si (stepi), ni (nexti).
run command.
Another technique that can be used for setting breakpoints is using offsets.
(gdb) break *main
Breakpoint 1 at 0x80484c4
(gdb) run
Starting program: bash_login

Breakpoint 1, 0x080484c4 in main ()
(gdb) disas main
Dump of assembler code for function main:
=> 0x080484c4 <+0>:,  push   ebp
   0x080484c5 <+1>: ,mov    ebp,esp
   0x080484c7 <+3>: ,and    esp,0xfffffff0
   0x080484ca <+6>: ,sub    esp,0x30
   0x080484cd <+9>: ,mov    DWORD PTR [esp+0x12],0x24243470
   0x080484d5 <+17>:,mov    DWORD PTR [esp+0x16],0x64723077
   0x080484dd <+25>:,mov    WORD PTR [esp+0x1a],0x21

.....Output ommited.....
(gdb) break *main+6
Breakpoint 2 at 0x80484ca
Examine and Print, your most powerful tools
GDB allows examining of memory locations be them specified as addresses or stored in registers. The x command (for examine) is arguably one of the most powerful tool in your arsenal and the most common command you are going to run when exploiting.
The format for the examine command is as follows:
(gdb) x/nfu [address]
        n:  How many units to print
        f:  Format character
              a Pointer
              c Read as integer, print as character
              d Integer, signed decimal
              f Floating point number
              o Integer, print as octal
              s Treat as C string (read all successive memory addresses until null character and print as characters)
              t Integer, print as binary (t="two")
              u Integer, unsigned decimal
              x Integer, print as hexadecimal
        u:  Unit
              b: Byte
              h: Half-word (2 bytes)
              w: Word (4 bytes)
              g: Giant word (8 bytes)
              i: Instruction (read n assembly instructions from the specified memory address)
In contrast with the examine command, which reads data at a memory location the print command (shorthand p) prints out values stored in registers and variables.
The format for the print command is as follows:
(gdb) p/f [what]
        f:  Format character
              a Pointer
              c Read as integer, print as character
              d Integer, signed decimal
              f Floating point number
              o Integer, print as octal
              s Treat as C string (read all successive memory addresses until null character and print as characters)
              t Integer, print as binary (t="two")
              u Integer, unsigned decimal
              x Integer, print as hexadecimal
              i Instruction (read n assembly instructions from the specified memory address)
For a better explanation please follow through with the following example:
#a breakpoint has been set inside the program and the program has been run with the appropriate commands to reach the breakpoint
#at this point we want to see which are the following 10 instructions
(gdb) x/10i 0x080484c7
   0x80484c7 <main+3>:,and    esp,0xfffffff0
   0x80484ca <main+6>:,sub    esp,0x30
   0x80484cd <main+9>:,mov    DWORD PTR [esp+0x12],0x24243470
   0x80484d5 <main+17>:,mov    DWORD PTR [esp+0x16],0x64723077
   0x80484dd <main+25>:,mov    WORD PTR [esp+0x1a],0x21
   0x80484e4 <main+32>:,mov    eax,0x8048630
   0x80484e9 <main+37>:,mov    DWORD PTR [esp],eax
   0x80484ec <main+40>:,call   0x80483b0 <printf@plt>
   0x80484f1 <main+45>:,mov    eax,0x804864a
   0x80484f6 <main+50>:,lea    edx,[esp+0x1c]
#let's examine the memory at 0x8048630 because we have a hint that the eax register holds a parameter
#as it is then placed on the stack (we'll explain later how we have reached this conclusion)
(gdb) x/s 0x8048630
0x8048630:, "\nPlease provide password:"
# we now set a breakpoint for main+37
(gdb) break *0x80484e9
Breakpoint 3 at 0x80484e9
(gdb) continue
Continuing.

Breakpoint 3, 0x080484e9 in main ()

#let's examine the eax register (it should hold the address for the beginning of the string so let's interpret it as appropriately)
#take note that in GDB registers are preceded by the "$" character very much like variables
(gdb) x/s $eax
0x8048630:, "\nPlease provide password:"
#now let's print the contents of the eax register as hexadecimal
(gdb) p/x $eax
$1 = 0x8048630
# as you can see the eax register hold the memory for the beginning of the string
# this shows you how "x" interprets data from memory while "p" merely prints out the contents in the required format
# you can think of it as "x" dereferencing while "p" not dereferencing
GDB command file
When exploiting, there are a couple of commands that you will issue periodically and doing that by hand will get cumbersome. GDB commands files will allow you to run a specific set of commands automatically after each command you issue manually. This comes in especially handy when you're stepping through a program and want to see what happens with the registers and stack after each instruction is ran, which is the main target when exploiting.
The examine command only has sense when code is already running on the machine so inside the file we are going to use the display command which translates to the same output.
In order to use this option you must first create your commands file. This file can include any GDB commands you like but a good start would be printing out the content of all the register values, the next ten instructions that are going to be executed, and some portion from the top of the stack.
The reason for examining all of the above after each instruction is ran will become more clear once the we go through the second section of the session.
Command file template:
display/10i $eip
display/x $eax
display/x $ebx
display/x $ecx
display/x $edx
display/x $edi
display/x $esi
display/x $ebp
display/32xw $esp
x command. However the values of all registers can be obtained by running the info all-registers command: (gdb) info all-registers eax 0x8048630,134514224 ecx 0xbffff404,-1073744892 edx 0xbffff394,-1073745004 ebx 0xb7fc6ff4,-1208193036 esp 0xbffff330,0xbffff330 ebp 0xbffff368,0xbffff368 esi 0x0,0 edi 0x0,0 eip 0x80484e9,0x80484e9 <main+37> eflags 0x286,[ PF SF IF ] cs 0x73,115 ss 0x7b,123 ds 0x7b,123 es 0x7b,123 fs 0x0,0 gs 0x33,51 st0 *value not available* st1 *value not available* st2 *value not available* st3 *value not available* st4 *value not available* st5 *value not available* st6 *value not available* st7 *value not available* fctrl 0x37f,895 fstat 0x0,0 ftag 0xffff,65535 fiseg 0x0,0 fioff 0x0,0 foseg 0x0,0 ---Type <return> to continue, or q <return> to quit--- fooff 0x0,0 fop 0x0,0 mxcsr 0x1f80,[ IM DM ZM OM UM PM ] ymm0 *value not available* ymm1 *value not available* ymm2 *value not available* ymm3 *value not available* ymm4 *value not available* ymm5 *value not available* ymm6 *value not available* ymm7 *value not available* mm0 *value not available* mm1 *value not available* mm2 *value not available* mm3 *value not available* mm4 *value not available* mm5 *value not available* mm6 *value not available* mm7 *value not available*
0xbffff…. format.
-x [command_file] parameter.
Using GDB to modify variables
GDB can be used to modify variables during runtime. In the case of exploitation this comes in handy as the program can be altered at runtime with the purpose of changing the execution path to desired branches.
GDB PEDA
As you can see using GDB can be cumbersome, this is why we recommend using the PEDA (Python Exploit Development Assistance for GDB) plugin presented in the previous session.
Give the fact that PEDA is just a wrapper, all the functionality of GDB will be available when running gdb-peda.
- Automatic preview of registers, code and stack after each instruction (you no longer need to create your own commands file)
- Automatic dereferencing and following through of memory locations
- Color coding
Gef and Pwndbg are two other GDB plugins that are popular for exploit development. You can use either one of them or use this configuration to switch between them. However, this tutorial is designed with PEDA in mind.
PEDA Commands
pdis command gives a pretty output that is similar to what the disas command in GDB prints:
Usage: pdis main
If pdis is used with an address as a parameter, the output will be similar to what x/Ni prints out (where N is the number of instructions you want to disassemble) Usage: -pdis [address] /N - where N is the number of instructions you want to be printed
The stepi command has the same effect as in GDB however, if you are running PEDA you will notice that after each step PEDA will automatically print register values, several lines of code from eip register and a portion of the stack:
gdb-peda$ stepi
[----------------------------------registers-----------------------------------]
EAX: 0x1
EBX: 0xb7fc6ff4 --> 0x1a0d7c
ECX: 0xbffff404 --> 0xbffff569 ("/home/dgioga/sss/bash_login")
EDX: 0xbffff394 --> 0xb7fc6ff4 --> 0x1a0d7c
ESI: 0x0
EDI: 0x0
EBP: 0xbffff368 --> 0x0
ESP: 0xbffff360 --> 0x8048560 (<__libc_csu_init>:,push   ebp)
EIP: 0x80484ca (<main+6>:,sub    esp,0x30)
EFLAGS: 0x286 (carry PARITY adjust zero SIGN trap INTERRUPT direction overflow)
[-------------------------------------code-------------------------------------]
   0x80484c4 <main>:,push   ebp
   0x80484c5 <main+1>:,mov    ebp,esp
   0x80484c7 <main+3>:,and    esp,0xfffffff0
=> 0x80484ca <main+6>:,sub    esp,0x30
   0x80484cd <main+9>:,mov    DWORD PTR [esp+0x12],0x24243470
   0x80484d5 <main+17>:,mov    DWORD PTR [esp+0x16],0x64723077
   0x80484dd <main+25>:,mov    WORD PTR [esp+0x1a],0x21
   0x80484e4 <main+32>:,mov    eax,0x8048630
[------------------------------------stack-------------------------------------]
0000| 0xbffff360 --> 0x8048560 (<__libc_csu_init>:,push   ebp)
0004| 0xbffff364 --> 0x0
0008| 0xbffff368 --> 0x0
0012| 0xbffff36c --> 0xb7e3f4d3 (<__libc_start_main+243>:,mov    DWORD PTR [esp],eax)
0016| 0xbffff370 --> 0x1
0020| 0xbffff374 --> 0xbffff404 --> 0xbffff569 ("/home/dgioga/sss/bash_login")
0024| 0xbffff378 --> 0xbffff40c --> 0xbffff585 ("SSH_AGENT_PID=1948")
0028| 0xbffff37c --> 0xb7fdc858 --> 0xb7e26000 --> 0x464c457f
[------------------------------------------------------------------------------]
Legend: code, data, rodata, value
0x080484ca in main ()
context regcontext codecontext stackcontext all
One additional PEDA command which can be used to show values in registers is the telescope command. The command dereferentiates pointer values until it gets to a value and prints out the entire trace.
The command can be used with both registers and memory addresses:
gdb-peda$ telescope $eax
0000| 0x8048630 ("\nPlease provide password:")
0004| 0x8048634 ("ase provide password:")
0008| 0x8048638 ("provide password:")
0012| 0x804863c ("ide password:")
0016| 0x8048640 ("password:")
0020| 0x8048644 ("word:")
0024| 0x8048648 --> 0x7325003a (':')
0028| 0x804864c --> 0x0
gdb-peda$ telescope 0x8048630
0000| 0x8048630 ("\nPlease provide password:")
0004| 0x8048634 ("ase provide password:")
0008| 0x8048638 ("provide password:")
0012| 0x804863c ("ide password:")
0016| 0x8048640 ("password:")
0020| 0x8048644 ("word:")
0024| 0x8048648 --> 0x7325003a (':')
0028| 0x804864c --> 0x0
In the example above, the memory address 0x8048630 was loaded into EAX. That is why examining the register or the memory location gives the same output.
help peda command It is always a better idea to use PEDA commands when available. However you should also know the basics of using GDB as well.
Altering variables and memory with PEDA and GDB
In addition to basic registers, GDB has a two extra variables which map onto some of the existing registers, as follows:
$pc – $eip$sp – $esp$fp – $ebp
In addition to these there are also two registers which can be used to view the processor state $ps – processor status
Values of memory addresses and registers can be altered at execution time. Because altering memory is a lot easier using PEDA we are going to use it throughout today's session.
set GDB command.
The easiest way of altering the execution flow of a program is editing the $eflags register just before jump instructions.
Using PEDA the $eflags register can be easily modified:
gdb-peda$ eflags
EFLAGS: 0x286 (carry PARITY adjust zero SIGN trap INTERRUPT direction overflow)
gdb-peda$ help eflags
Display/set/clear value of eflags register
Usage:
    eflags
    eflags [set|clear] flagname
eflags command is issued.
The patch command can be used to modify values that reside inside memory.
gdb-peda$ telescope 0x8048630
0000| 0x8048630 ("\nPlease provide password:")
0004| 0x8048634 ("ase provide password:")
0008| 0x8048638 ("provide password:")
0012| 0x804863c ("ide password:")
0016| 0x8048640 ("password:")
0020| 0x8048644 ("word:")
0024| 0x8048648 --> 0x7325003a (':')
0028| 0x804864c --> 0x0
gdb-peda$ help patch
Patch memory start at an address with string/hexstring/int
Usage:
    patch address (multiple lines input)
    patch address "string"
    patch from_address to_address "string"
    patch (will patch at current $pc)

gdb-peda$ patch 0x8048630 "Modified valu of the string\x00"
Written 28 bytes to 0x8048630
gdb-peda$ telescope 0x8048630
0000| 0x8048630 ("Modified valu of the string")
0004| 0x8048634 ("fied valu of the string")
0008| 0x8048638 (" valu of the string")
0012| 0x804863c ("u of the string")
0016| 0x8048640 (" the string")
0020| 0x8048644 (" string")
0024| 0x8048648 --> 0x676e69 ('ing')
0028| 0x804864c --> 0x0
As you can see the string residing in memory at address 0x8048630 has been modified using the patch command.
PEDA does not offer enhancements in modifying registry values. For modifying registry values you can use the GDB set command.
gdb-peda$ p/x $eax
$10 = 0x1
gdb-peda$ set $eax=0x80
gdb-peda$ p/x $eax
$11 = 0x80
Enough with GDB (for a while)
The following section will describe the process of function calling in detail. Understanding function calling and stack operations during program execution is esential to exploitation.
The Stack
The stack is one of the areas of memory which gets the biggest attention in exploitation writing.
Stack Growth
The stack grows from high memory addresses to low memory addresses.
gdb-peda$ pdis $eip
Dump of assembler code from 0x8048386 to 0x80483a6:
=> 0x08048386 <printf@plt+6>:,push   0x0
   0x0804838b <printf@plt+11>:,jmp    0x8048370
   0x08048390 <puts@plt+0>:,jmp    DWORD PTR ds:0x804a004
   0x08048396 <puts@plt+6>:,push   0x8
   0x0804839b <puts@plt+11>:,jmp    0x8048370
   0x080483a0 <__gmon_start__@plt+0>:,jmp    DWORD PTR ds:0x804a008
End of assembler dump.
gdb-peda$ p/x $esp
$4 = 0xbffff33c
gdb-peda$ si
0x0804838b in printf@plt ()
gdb-peda$ p/x $esp
$5 = 0xbffff338
As you can see from the example above the $esp register had an initial value of 0xbffff33c. The next instruction that is about to be executed is a push (it pushes 0x0 on the stack). We execute the instruction and then reevaluate the value of $esp. As we can see $esp now points to 0xbffff338 (0xbffff33c-0x4).
Frame pointers and local function variables
Whenever the processor is entering the execution for a function, a special logical container is created on the stack for that function.
This container is called a function frame. The idea behind it is that the processor must know which area of the stack belongs to which function.
In order to achieve this logical segmentation a set of 2 instructions are automatically inserted by the compiler at the beginning of each function. Can you tell what they are based on the output below?
gdb-peda$ break main
Breakpoint 1 at 0x80484c8
gdb-peda$ run
[----------------------------------registers-----------------------------------]
EAX: 0x1
EBX: 0xb7fc6ff4 --> 0x1a0d7c
ECX: 0xbffff404 --> 0xbffff56a ("/home/dgioga/sss/bash_login")
EDX: 0xbffff394 --> 0xb7fc6ff4 --> 0x1a0d7c
ESI: 0x0
EDI: 0x0
EBP: 0xbffff368 --> 0x0
ESP: 0xbffff368 --> 0x0
EIP: 0x80484c8 (<main+3>:,and    esp,0xfffffff0)
EFLAGS: 0x200246 (carry PARITY adjust ZERO sign trap INTERRUPT direction overflow)
[-------------------------------------code-------------------------------------]
   0x80484c4 <pass_accepted+48>:,ret
   0x80484c5 <main>:  ,push   ebp
   0x80484c6 <main+1>:,mov    ebp,esp
=> 0x80484c8 <main+3>:,and    esp,0xfffffff0
   0x80484cb <main+6>:,sub    esp,0x20
   0x80484ce <main+9>:,mov    DWORD PTR [esp+0x12],0x24243470
   0x80484d6 <main+17>:,mov    DWORD PTR [esp+0x16],0x64723077
   0x80484de <main+25>:,mov    WORD PTR [esp+0x1a],0x21
[------------------------------------stack-------------------------------------]
0000| 0xbffff368 --> 0x0
0004| 0xbffff36c --> 0xb7e3f4d3 (<__libc_start_main+243>:,mov    DWORD PTR [esp],eax)
0008| 0xbffff370 --> 0x1
0012| 0xbffff374 --> 0xbffff404 --> 0xbffff56a ("/home/dgioga/sss/bash_login")
0016| 0xbffff378 --> 0xbffff40c --> 0xbffff586 ("SSH_AGENT_PID=1948")
0020| 0xbffff37c --> 0xb7fdc858 --> 0xb7e26000 --> 0x464c457f
0024| 0xbffff380 --> 0x0
0028| 0xbffff384 --> 0xbffff41c --> 0xbffff5df ("XDG_SESSION_COOKIE=6c6a623c38e4681198250a9800000004-1350211342.292816-1022470579")
[------------------------------------------------------------------------------]
Legend: code, data, rodata, value

Breakpoint 1, 0x080484c8 in main ()
gdb-peda$ break pass_accepted
Breakpoint 2 at 0x804849a
gdb-peda$ continue

Please provide password:XX
[----------------------------------registers-----------------------------------]
EAX: 0x1a
EBX: 0xb7fc6ff4 --> 0x1a0d7c
ECX: 0x1a
EDX: 0x0
ESI: 0x0
EDI: 0x0
EBP: 0xbffff338 --> 0xbffff368 --> 0x0
ESP: 0xbffff320 --> 0xbffff368 --> 0x0
EIP: 0x804849a (<pass_accepted+6>:,mov    eax,0x8048620)
EFLAGS: 0x200282 (carry parity adjust zero SIGN trap INTERRUPT direction overflow)
[-------------------------------------code-------------------------------------]
   0x8048494 <pass_accepted>:   ,push   ebp
   0x8048495 <pass_accepted+1>: ,mov    ebp,esp
   0x8048497 <pass_accepted+3>: ,sub    esp,0x18
=> 0x804849a <pass_accepted+6>: ,mov    eax,0x8048620
   0x804849f <pass_accepted+11>:,mov    DWORD PTR [esp],eax
   0x80484a2 <pass_accepted+14>:,call   0x8048380 <printf@plt>
   0x80484a7 <pass_accepted+19>:,mov    DWORD PTR [esp+0x8],0x0
   0x80484af <pass_accepted+27>:,mov    DWORD PTR [esp+0x4],0x0
[------------------------------------stack-------------------------------------]
0000| 0xbffff320 --> 0xbffff368 --> 0x0
0004| 0xbffff324 --> 0xb7ff26a0 (pop    edx)
0008| 0xbffff328 --> 0xbffff35c --> 0x1a
0012| 0xbffff32c --> 0xb7fc6ff4 --> 0x1a0d7c
0016| 0xbffff330 --> 0x0
0020| 0xbffff334 --> 0x0
0024| 0xbffff338 --> 0xbffff368 --> 0x0
0028| 0xbffff33c --> 0x8048536 (<main+113>:,mov    eax,0x0)
[------------------------------------------------------------------------------]
Legend: code, data, rodata, value

Breakpoint 2, 0x0804849a in pass_accepted ()
What we did is we created a breakpoint for the start of the main function and then ran the program. As you can see the first 2 instructions that got executed were push ebp and mov ebp,esp.
We then set a breakpoint for another function called pass_accepted, continued execution and entered a password that we know is going to pass validation. Once the breakpoint is hit, we can see the same 2 instructions push ebp and mov ebp,esp.
The two instructions which can be noticed at the beginning of any function are the instructions required for creating the logical container for each function on the stack.
In essence what they do is save the reference of the old container (push ebp) and record the current address at the top of the stack as the beginning of the new container(mov ebp,esp).
For a visual explanation please see below:
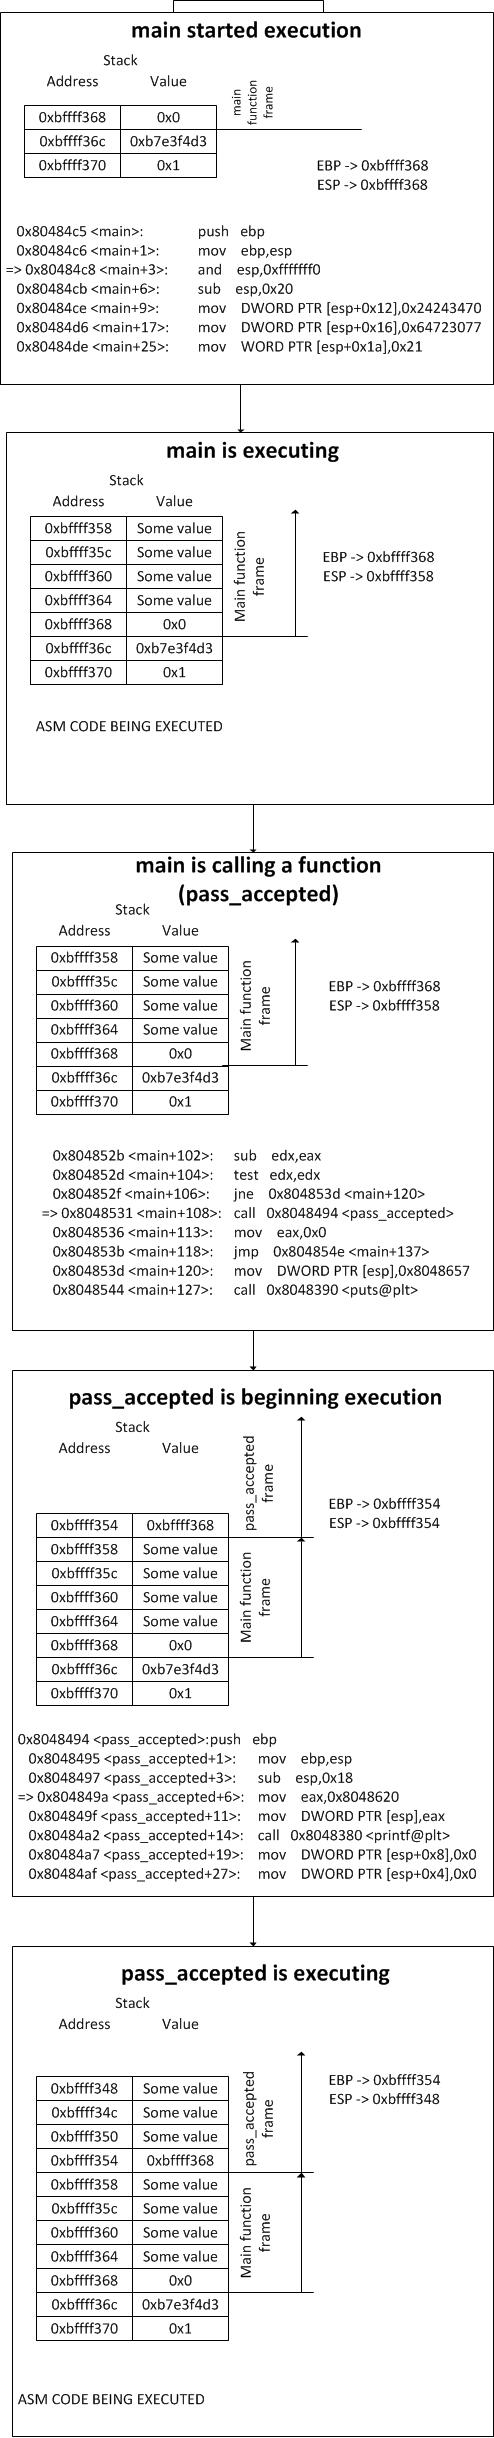
As you can see the EBP register always points to the stack address that corresponds to the beginning of the current function's frame. That is why it is most often referred to as the frame pointer.
In addition to the two instructions required for creating a new stack frame for a function, there are a couple more instructions that you will usually see at the beginning of a function
If you analyze the instructions at the beginning of main, you can spot these as being:
- An
and esp,0xfffffff0instruction. - A
subinsctruction that subtracts a hex value from ESP.
The first of the two instructions has the purpose of aligning the stack to a specific address boundary. This is done to increase processor efficiency. In our specific case, the top of the stack gets aligned to a 16 byte multiple address.
One of the purposes of the stack inside functions is that of offering address space in which to place local variables. The second instruction preallocates space for local function variables.
Let's see how local variables are handled inside assembly code.
#include <stdio.h>
int main()
{
        int a;
        a=1;
        return 0;
}
dgioga@eragon:~/sss$ gdb test
GNU gdb (Ubuntu/Linaro 7.4-2012.02-0ubuntu2) 7.4-2012.02
Copyright (C) 2012 Free Software Foundation, Inc.
License GPLv3+: GNU GPL version 3 or later <http://gnu.org/licenses/gpl.html>
This is free software: you are free to change and redistribute it.
There is NO WARRANTY, to the extent permitted by law.  Type "show copying"
and "show warranty" for details.
This GDB was configured as "i686-linux-gnu".
For bug reporting instructions, please see:
<http://bugs.launchpad.net/gdb-linaro/>...
Reading symbols from /home/dgioga/sss/test...(no debugging symbols found)...done.
gdb-peda$ break main
Breakpoint 1 at 0x80483ba
gdb-peda$ run
[----------------------------------registers-----------------------------------]
EAX: 0x1
EBX: 0xb7fc6ff4 --> 0x1a0d7c
ECX: 0xbffff414 --> 0xbffff576 ("/home/dgioga/sss/test")
EDX: 0xbffff3a4 --> 0xb7fc6ff4 --> 0x1a0d7c
ESI: 0x0
EDI: 0x0
EBP: 0xbffff378 --> 0x0
ESP: 0xbffff368 --> 0x80483d9 (<__libc_csu_init+9>:,add    ebx,0x1c1b)
EIP: 0x80483ba (<main+6>:,mov    DWORD PTR [ebp-0x4],0x1)
EFLAGS: 0x200282 (carry parity adjust zero SIGN trap INTERRUPT direction overflow)
[-------------------------------------code-------------------------------------]
   0x80483b4 <main>:,  push   ebp
   0x80483b5 <main+1>:,mov    ebp,esp
   0x80483b7 <main+3>:,sub    esp,0x10
=> 0x80483ba <main+6>:,mov    DWORD PTR [ebp-0x4],0x1
   0x80483c1 <main+13>:,mov    eax,0x0
   0x80483c6 <main+18>:,leave
   0x80483c7 <main+19>:,ret
   0x80483c8:,nop
[------------------------------------stack-------------------------------------]
0000| 0xbffff368 --> 0x80483d9 (<__libc_csu_init+9>:,add    ebx,0x1c1b)
0004| 0xbffff36c --> 0xb7fc6ff4 --> 0x1a0d7c
0008| 0xbffff370 --> 0x80483d0 (<__libc_csu_init>:,push   ebp)
0012| 0xbffff374 --> 0x0
0016| 0xbffff378 --> 0x0
0020| 0xbffff37c --> 0xb7e3f4d3 (<__libc_start_main+243>:,mov    DWORD PTR [esp],eax)
0024| 0xbffff380 --> 0x1
0028| 0xbffff384 --> 0xbffff414 --> 0xbffff576 ("/home/dgioga/sss/test")
[------------------------------------------------------------------------------]
Legend: code, data, rodata, value

Breakpoint 1, 0x080483ba in main ()
As you can see the operations that relate to the stack are:
- The old frame pointer is saved.
- EBP takes the value of ESP (the frame pointer is set to point to the current function's frame).
0x10is subtracted from ESP (reserve space for local variables).- The value
0x01is placed at the address of EBP-0x4 (the local variableatakes the value 1).
Function parameters
The stack is also used to pass in parameters to functions.
In the process of calling a function we can define two entities. The callee (the function that gets called) and the caller (the function that calls).
When a function is called, the caller pushes the parameters for the callee on the stack. The parameters are pushed in reverse order.
When the callee wants to get access to the parameters it was called with, all it needs to do is access the area of the stack that is higher up in reference to the start of it's frame.
- When EBP+value is referred to it is generally a referral to a parameter passed in to the current function.
- When EBP-value is referred to it is generally a referral to a local variable.
Lets see how this happens with the following code:
#include <stdio.h>

int add(int a, int b)
{
        int c;
        c=a+b;
        return c;
}

int main()
{
        add(10,3);
        return 0;
}
gdb-peda$ pdis main
Dump of assembler code for function main:
   0x080483ca <+0>:,push   ebp                        #save the old frame pointer
   0x080483cb <+1>:,mov    ebp,esp                    #create the new frame pointer
   0x080483cd <+3>:,sub    esp,0x8                    #create space for local variables
   0x080483d0 <+6>:,mov    DWORD PTR [esp+0x4],0x3    #push the last parameter of the function that is to be called
   0x080483d8 <+14>:,mov    DWORD PTR [esp],0xa      #push the second to last(the first in this case) parameter of the function that is to be called
   0x080483df <+21>:,call   0x80483b4 <add>          #call the function
   0x080483e4 <+26>:,mov    eax,0x0
   0x080483e9 <+31>:,leave
   0x080483ea <+32>:,ret
End of assembler dump.
gdb-peda$ pdis add
Dump of assembler code for function add:
   0x080483b4 <+0>:,push   ebp                        #save the old frame pointer
   0x080483b5 <+1>:,mov    ebp,esp                    #create a new frame pointer
   0x080483b7 <+3>:,sub    esp,0x10                   #create space for local variables
   0x080483ba <+6>:,mov    eax,DWORD PTR [ebp+0xc]    #move the first parameter into the EAX register (ebp+saved_ebp(4 bytes)+return_addres(4 bytes)+last_parameter(4 bytes))
   0x080483bd <+9>:,mov    edx,DWORD PTR [ebp+0x8]    #move the second parameter into the EDX register (ebp+saved_ebp(4 bytes)+return_addres(4 bytes))
   0x080483c0 <+12>:,add    eax,edx                  #add the registers
   0x080483c2 <+14>:,mov    DWORD PTR [ebp-0x4],eax  #place the result inside the local variable (c)
   0x080483c5 <+17>:,mov    eax,DWORD PTR [ebp-0x4]  #place the result inside the eax register in order to return it
   0x080483c8 <+20>:,leave
   0x080483c9 <+21>:,ret
End of assembler dump.
As you can see the parameters were pushed in reverse order, and the rule regarding the reference to EBP holds.
If you don't understand why the offset for the parameters starts at EBP+0x08 and not EBP follow through with the next section.
Calling functions (call and ret)
When calling a function the callee places the return address on the stack. This address is nothing more than a bookmark so that execution can resume where it left off once the called function finishes execution.
The last instruction in functions is usually a ret instruction that resumes execution to the callee.
For a better understanding of function calling and returning, from an execution flow point of view, please follow through with the following tip.
push eipmov eip, address_of_called_function
The ret instruction could be translated into:
- pop eip
The visual depiction of how the stack looks while a program is executing can be found in section 2 but will be included here as well:

Buffer Overflows
Now that we have a complete overview of the stack we can step forward to stack based buffer overflows.
A buffer overflow takes place when there is a lack of checking regarding boundaries and usually result in complete control of the program's instruction pointer. This takes place when a buffer overflows its boundaries and overwrites the return address of a function.
A typical example of buffer overflows can be seen in the following picture:

Challenges
01. Challenge - Explore The Simple Password Protected Bash
Use GDB and PEDA to run the code provided in the Challenges archive. The executable gets input from the user and evaluates it against a static condition. If it succeeds it then calls a password_accepted function that prints out a success message and spawns a shell.
Your task is to use GDB and PEDA to force the executable to call the password_accepted function.
Think of modifying registers for forcing the executable to call the function (there is more than one way of doing this).
02. Challenge - Simple Password Protected Bash Destruction
What is the condition against which your input is evaluated in the executable contained in the executable sppb?
password_accepted function is called (modifying registers while running the program in GDB is just for training purposes).
03. Challenge - Domino
Analyse the binary, reverse engineer what it does and get a nice message back.
04. Challenge - Call me
Investigate the binary in 04-challenge-call-me/src/call_me and find out the flag.
05. Challenge - Snooze Me
I wrote a simple binary that computes the answer to life, the universe and everything. It swear it works… eventually.
06. Challenge - Phone Home
To protect their confidential data from those snooping cloud providers, the authors of 06-challenge-phone-home/src/phone_home have used some obfuscation techniques.
Unfortunately, the key feature of the application is now unreachable due to a bug. Can you bypass the impossible condition?